Cardiac Output in Critical Care: A Guide for ICU Nurses
Cardiac output is the primary determinant of oxygen delivery to every tissue in your patient’s body, and it is the hemodynamic trigger you use to classify shock, decide between fluids and vasoactive therapy, and evaluate whether your interventions are actually working. When CO falls, oxygen delivery falls with it, and the downstream consequences, rising lactate, falling ScvO2, worsening organ function, follow fast. The role of cardiac output in critical care is not passive monitoring. It drives decisions.
At the bedside, CO informs:
- Shock classification: Is this distributive, cardiogenic, hypovolemic, or obstructive?
- Fluid vs. inotrope choice: Does the patient need volume, or will more fluid just flood the lungs?
- Vasopressor titration: Is the MAP improving because perfusion improved, or just because resistance went up?
- Escalation to mechanical support: Is the CI trending down despite maxed vasoactives?
- Response to therapy: Is the intervention actually moving the needle?
Two numbers anchor every CO conversation in the ICU: a cardiac index (CI) within the normal clinical range is typical, and a CI below a certain threshold commonly triggers consideration of inotropic support.
Table of Contents
- What is cardiac output, and what are the normal ranges?
- How is cardiac output measured in the ICU?
- When should you measure cardiac output in the ICU?
- How do you interpret cardiac output at the bedside?
- How does cardiac output guide therapy step by step?
- What are the limitations and safety risks of CO monitoring?
- Practical bedside workflows for ICU nurses
- What’s new in cardiac output monitoring research?
- Key Takeaways
- A nurse-to-nurse perspective on CO monitoring
- Zerodeficitccrnprep helps you master hemodynamics for the CCRN
- Selected sources and further reading
- FAQ
What is cardiac output, and what are the normal ranges?
CO equals heart rate multiplied by stroke volume (CO = HR × SV), measured in liters per minute. At rest, normal CO runs 5–6 L/min in most adults, though elite athletes can exceed 35 L/min during maximal exercise. Because body size matters, the cardiac index (CI = CO ÷ body surface area) standardizes the number across patients.
The four determinants of CO are:
- Preload: End-diastolic ventricular volume; more stretch means more force via the Frank-Starling mechanism.
- Afterload: The resistance the ventricle must overcome to eject blood; inversely related to stroke volume.
- Contractility (inotropy): The intrinsic force of myocyte contraction, independent of preload and afterload.
- Heart rate: Faster rates increase CO up to a point; beyond that, diastolic filling time shortens and SV drops.
Oxygen delivery (DO₂) ties directly to CO: DO₂ = CO × CaO₂, where CaO₂ is arterial oxygen content. Drop CO and DO₂ falls proportionally, regardless of what the SpO₂ reads.
CI normal range is clinically established within a standard range, and CI thresholds are used as clinical markers for intervention; resting CO values are generally within known adult ranges.
Pro Tip: When a patient’s MAP looks acceptable but lactate is climbing, check the CI. A CI below 2.2 L/min/m² with rising lactate tells you the heart is not keeping up, even if the blood pressure is holding.
How is cardiac output measured in the ICU?
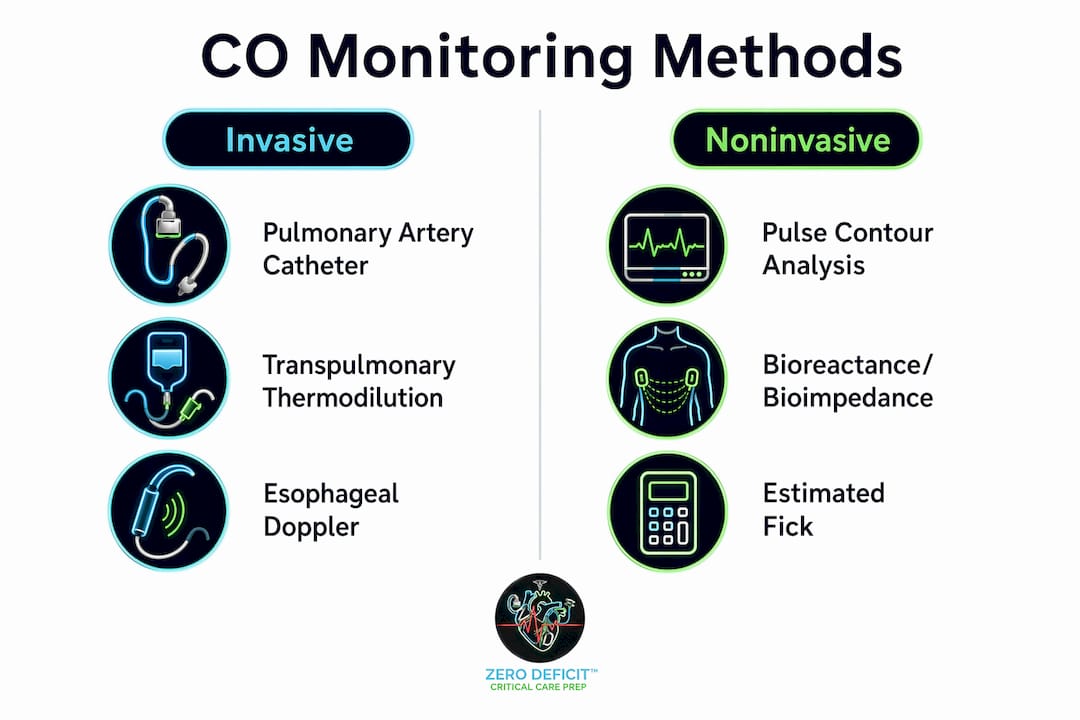
Methods range from invasive pulmonary artery catheters to noninvasive bioimpedance systems, and no single technique is right for every patient. Here is what you need to know about each one.

Pulmonary artery catheter (thermodilution / Swan-Ganz)
The PAC remains the clinical gold standard for CO measurement. Cold saline is injected into the right atrium, and a thermistor at the catheter tip measures the temperature change over time. CO is calculated from the area under the curve. It is intermittent unless a continuous thermodilution PAC is used, and it also gives you pulmonary artery pressures, PAOP, and mixed venous oxygen saturation (SvO₂), data you cannot get from any other single device. The tradeoffs are real: central venous access, risk of pulmonary artery rupture, catheter-related infection, and arrhythmias during insertion.
Transpulmonary thermodilution (PiCCO-style systems)
Cold saline is injected centrally and detected by an arterial thermistor, typically in the femoral or axillary artery. This gives calibrated pulse contour CO plus volumetric preload markers (global end-diastolic volume, GEDV) and extravascular lung water (EVLW), which is particularly useful in ARDS and sepsis. Calibration is required every 8 hours or after major hemodynamic shifts.
Pulse contour analysis (uncalibrated, FloTrac/EV1000-style)
These systems derive CO continuously from the arterial waveform without requiring a calibration bolus. They are minimally invasive (arterial line only) and easy to set up, making them common in post-cardiac-surgery and high-dependency units. The limitation is accuracy: in states of peripheral vasoplegia, arrhythmia, or low flow, the algorithm’s assumptions break down and readings drift.

Esophageal Doppler
A probe placed in the esophagus measures aortic blood flow velocity using Doppler ultrasound. It is continuous and minimally invasive, but requires sedation and an intubated patient. Accuracy depends on probe positioning and operator technique. It is well-validated for intraoperative and early postoperative use.
Estimated Fick (eFick) and direct Fick
The Fick principle calculates CO from oxygen consumption divided by the arteriovenous oxygen difference: CO = VO₂ ÷ (CaO₂ − CvO₂). Direct Fick requires measured VO₂, which is rarely done outside research. Estimated Fick uses assumed VO₂ values and is less accurate but useful when other methods are unavailable or unreliable.
Bioreactance and bioimpedance (NICOM-style)
Electrical signals are passed across the thorax, and changes in impedance or phase shift are used to estimate CO. Completely noninvasive, these systems are useful for transport monitoring and lower-acuity surveillance. However, accuracy is limited in vasoplegia, low-flow states, severe edema, and obesity, so use them cautiously in the sickest ICU patients.
Comparison table
| Method | Invasiveness | Continuous? | Calibration needed | Key limitations | Best use cases | Nursing considerations |
|---|---|---|---|---|---|---|
| PAC thermodilution | Invasive | Intermittent (or continuous PAC) | No (technique-dependent) | Arrhythmia, valve disease, operator variability | RV failure, VA-ECMO, refractory shock | Injection technique, arrhythmia monitoring, infection surveillance |
| Transpulmonary thermodilution (PiCCO) | Invasive (central + arterial) | Continuous (calibrated) | Yes, every 8 hrs or after hemodynamic shift | Open chest, arrhythmia, aortic valve disease | ARDS, septic shock, complex fluid management | Calibration timing, arterial line patency |
| Pulse contour (uncalibrated) | Minimally invasive (arterial line) | Continuous | No | Vasoplegia, arrhythmia, low flow | Post-cardiac surgery, high-dependency monitoring | Waveform quality, damping check |
| Esophageal Doppler | Minimally invasive | Continuous | No (probe position) | Requires sedation/intubation, probe placement | Intraoperative, early postop | Probe repositioning, patient tolerance |
| Estimated Fick | Noninvasive (uses lab values) | Intermittent | No | Assumed VO₂ introduces error | Backup when devices unavailable | Accurate SaO₂ and SvO₂ sampling required |
| Bioreactance / bioimpedance | Noninvasive | Continuous | No | Edema, obesity, vasoplegia, low flow | Transport, lower-acuity surveillance | Electrode placement, skin integrity |
Pro Tip: Continuous trend detection often gives you more actionable information than a single intermittent gold-standard measurement. Match the monitoring intensity to the patient’s acuity and the clinical question you are trying to answer.
When should you measure cardiac output in the ICU?
Not every ICU patient needs invasive CO monitoring, but several clinical situations make it worth the risk and effort.
Clear indications:
- Undifferentiated shock not responding to initial fluids and vasopressors
- Suspected cardiogenic shock or acute RV failure
- Complex postoperative monitoring after cardiac surgery
- Patients on mechanical circulatory support (IABP, Impella, VA-ECMO)
- Severe ARDS with hemodynamic instability
- Repeated passive leg raising or mini-fluid challenge testing where you need real-time CO response
- Refractory septic shock where you cannot determine whether the problem is flow or distribution
Patient groups most likely to benefit:
- Suspected RV failure (CO monitoring plus PA pressures changes management)
- VA-ECMO patients, where native CO and device flow must be tracked together
- Patients with complex fluid management needs (ARDS + shock + AKI)
- Post-cardiac-surgery patients with low-output syndrome
Two brief case examples:
-
A 68-year-old with septic shock, MAP 58 on norepinephrine, lactate 4.2, and ScvO₂ 58%: the low ScvO₂ suggests inadequate delivery. A transpulmonary thermodilution system reveals CI of 1.9 L/min/m². The team adds dobutamine. This is a case where CO monitoring changed the therapy.
-
A 55-year-old post-CABG with MAP 65, CI 2.6 L/min/m², and rising lactate: the CI is technically normal, but lactate is climbing. This points toward microcirculatory failure rather than global low flow, and more fluid is unlikely to help. CO monitoring here prevents harmful over-resuscitation.
Pro Tip: For patients on mechanical circulatory support, native CO and device flow are separate numbers. Know which one your monitor is reporting.
How do you interpret cardiac output at the bedside?
Prioritize trends and responses to interventions over any single absolute value. A CI of 2.1 L/min/m² that is rising after dobutamine tells a very different story than one that is falling despite maxed support.
Practical interpretation framework:
- Check the CI against thresholds. CI 2.5–4.0 L/min/m² is normal. CI below 2.2 L/min/m² is a trigger to act, not just document.
- Pair CO with ScvO₂ or SvO₂. ScvO₂ below 65–70% alongside low CI confirms inadequate delivery. ScvO₂ above 80% with low CI in sepsis may indicate microcirculatory shunting, not adequate perfusion.
- Check lactate and the veno-arterial CO₂ gap. A rising lactate despite a normal or elevated CO points toward microcirculatory dysfunction, a pattern common in septic shock where CO can be preserved or even elevated while tissue oxygenation remains inadequate.
- Use dynamic tests with real-time CO measurement. Passive leg raising (PLR) is a reversible preload challenge: raise the legs to 45° and measure CO within 60–90 seconds. A PLR-induced CO increase of 10% or more predicts fluid responsiveness. The effect is transient, so you need continuous CO monitoring to catch it.
- Interpret SVV and PPV with caution. Stroke volume variation (SVV) and pulse pressure variation (PPV) predict fluid responsiveness only in fully mechanically ventilated patients with no arrhythmia and tidal volumes of at least 8 mL/kg. Spontaneous breathing effort, arrhythmias, and low tidal volumes all invalidate these indices.
Simple bedside algorithm:
- Low CI + fluid responsive (PLR positive) → give a fluid bolus, reassess CO
- Low CI + not fluid responsive → consider inotrope (see vasoactive medications guide)
- Normal CI + rising lactate → investigate microcirculation, check ScvO₂, reassess vasopressor dose
- Low CI + high filling pressures + not fluid responsive → consider mechanical support
CI <2.2 L/min/m² is the common inotrope-consideration threshold. A PLR-induced CO increase of ≥10% confirms fluid responsiveness when measured with continuous CO monitoring.
Pro Tip: Changes in CO must exceed the device’s least significant change to be real. Some pulse-contour methods have precision errors of 1–2%, but others are wider. Know your device’s published precision before calling a small CO shift a clinical response.
How does cardiac output guide therapy step by step?
Use CO trends plus fluid-responsiveness data and perfusion markers to choose between fluids, vasoactive agents, and escalation. Here is the sequence:
- Confirm the reading is valid. Check for arrhythmia, verify zeroing and calibration, confirm catheter or probe position, and note any recent vasoactive changes or vent setting adjustments that could shift CO artificially.
- Choose your dynamic test. PLR if the patient is on controlled ventilation or spontaneously breathing. Mini-fluid challenge (100–150 mL over 1 minute with CO measured before and after) when PLR is not feasible (recent abdominal surgery, elevated ICP, severe hypoxemia requiring positioning).
- Interpret the CO response.
- CO increases ≥10% with PLR: fluid responsive. Give a bolus and reassess.
- CO does not increase: not fluid responsive. Stop fluids. Evaluate for inotrope need or mechanical support.
- Titrate vasoactives based on CO + MAP + perfusion markers. A rising MAP with stable or falling CO after a vasopressor increase means you improved resistance, not flow. That matters when the problem is distributive shock.
- Escalate monitoring when CO trends down despite therapy. Falling CI below 2.0 L/min/m² despite inotropes, worsening lactate, and rising filling pressures: this is the picture that warrants a call about mechanical circulatory support.
Case example: A septic patient with CI 3.8 L/min/m² (elevated), SvO₂ 82% (high), and lactate 5.1 mmol/L. The high CO and high SvO₂ look reassuring, but the lactate tells you tissues are not using the oxygen being delivered. This is microcirculatory failure. Adding more fluid or inotropes will not fix it. The focus shifts to source control, vasopressor optimization, and avoiding further harm.
Nursing escalation template: “Patient [name], CI trending from 2.4 to 1.9 over the last two hours, lactate up from 2.1 to 3.8, ScvO₂ 61%, MAP 62 on norepinephrine 0.18 mcg/kg/min. Requesting provider assessment for inotrope initiation and hemodynamic monitoring upgrade.”
Pro Tip: Before calling for an inotrope, confirm the patient is not just tachycardic and volume-depleted. A heart rate of 130 with a low SV is a different problem than a heart rate of 80 with poor contractility. CO = HR × SV. Know which variable is failing.
What are the limitations and safety risks of CO monitoring?
Every method has failure modes, and knowing them protects your patient from acting on bad data.
Common sources of error by technique:
- Thermodilution (PAC): Inconsistent injection volume or speed, tricuspid regurgitation (recirculates injectate), intracardiac shunts, and rapid fluid infusions through the same lumen all skew results.
- Pulse contour (uncalibrated): Vasoplegia, arrhythmias, and peripheral vasoconstriction all corrupt the waveform-based algorithm. Accuracy degrades without recalibration after major hemodynamic shifts.
- Bioreactance / bioimpedance: Severely ill patients with edema, obesity, or low-flow states show the largest accuracy gaps. These systems are not validated for high-acuity shock management.
- Esophageal Doppler: Probe malposition is the primary error source. Even small probe movements change the measured velocity and the calculated CO.
- Transpulmonary thermodilution: Open-chest surgery and severe aortic valve disease invalidate the algorithm. Calibration drift occurs with rapid hemodynamic changes.
Patient scenarios that invalidate specific methods:
- Severe arrhythmias (atrial fibrillation with rapid ventricular response, frequent PVCs): invalidate SVV, PPV, and pulse-contour CO
- Open chest or pericardial effusion: invalidates transpulmonary thermodilution
- Severe peripheral vasoconstriction: degrades all arterial waveform-based methods
- Significant tricuspid regurgitation: causes PAC thermodilution to overestimate CO
Safety considerations with invasive monitors:
- PAC insertion carries risks of pneumothorax, pulmonary artery rupture, catheter-related bloodstream infection, and arrhythmias during placement.
- Arterial lines for pulse-contour systems require vigilant monitoring for thrombosis, distal ischemia, and disconnection.
- All invasive catheters require daily necessity review per SCCM and AACN guidelines.
Shift-start verification checklist:
- Zero and level the transducer
- Confirm calibration status and timing of last calibration
- Verify catheter or probe position (chest X-ray for PAC tip, probe depth for esophageal Doppler)
- Review recent vasoactive changes that may require recalibration
- Confirm injection technique and volume for thermodilution (typically 10 mL cold saline, three measurements averaged)
Pro Tip: If two consecutive CO readings differ by more than 10–15%, do not average them and move on. Repeat the measurement, check your technique, and look for a clinical reason (arrhythmia, vent change, position change) before acting on either number.
Practical bedside workflows for ICU nurses
Nurses are often the first to detect a CO trend change, and clear workflows make that detection clinically useful.
Hourly monitoring checklist:
- CI or CO trend (direction matters more than a single value)
- ScvO₂ or SvO₂ (target ScvO₂ ≥70%)
- Lactate (trend, not just the number)
- Urine output (target ≥0.5 mL/kg/hr)
- Capillary refill time and skin temperature
- Vasoactive infusion rates and any recent changes
Troubleshooting discrepant CO values:
- Is there a new arrhythmia? (Check rhythm strip)
- Has the transducer been zeroed since the last position change?
- Is calibration overdue or was there a recent hemodynamic shift?
- Did the catheter migrate? (Check waveform morphology)
- Were there recent vasoactive or vent changes?
- Is the injection technique consistent? (Volume, speed, temperature)
Step-by-step PLR with continuous CO monitoring:
- Document baseline CI/CO, MAP, HR, and ScvO₂.
- Lay the patient flat (from a 30–45° head-of-bed position) and raise legs to 45°.
- Measure CO continuously for 60–90 seconds. The peak effect is transient.
- A CO increase of ≥10% from baseline indicates fluid responsiveness.
- Return the patient to the original position and document the response.
- Report findings to the provider with the baseline and peak CO values.
Communication template for multidisciplinary handoff:
“[Patient name], [diagnosis], currently on [vasoactive agents and doses]. CI [current value], trending [up/down/stable] over the last [time period]. Lactate [value], ScvO₂ [value]. Last PLR [positive/negative]. Calibration last performed [time]. Pending: [provider order/reassessment/device recalibration].”
Pro Tip: Effective therapeutic communication during handoff is not just about listing numbers. Frame the trend: “CI has dropped from 2.6 to 1.9 over four hours” lands differently than “CI is 1.9.” The trend is the story.
What’s new in cardiac output monitoring research?
The clearest trend in CO monitoring is the shift toward less invasive and continuous methods, driven by the goal of reducing procedure-related risk while preserving real-time trend data. Noninvasive systems (bioreactance, finger-cuff pulse contour, continuous Doppler) are increasingly evaluated in clinical trials, but their validation in the most severely ill ICU patients remains incomplete.
Key developments and evidence gaps:
- Uncalibrated pulse-contour systems perform well in hemodynamically stable post-surgical patients but lose accuracy in septic shock and vasoplegia without recalibration.
- Bioreactance and bioimpedance show acceptable trending ability in moderate-acuity patients but are not yet validated as primary monitors in refractory shock.
- Integration of CO monitoring with automated alarm systems and clinical decision support is an active area of development; early data suggest that protocol-driven use of CO data can reduce ICU stay and organ dysfunction in select populations.
- Remote monitoring during intrahospital transport is a growing use case for noninvasive systems, where the alternative is no CO monitoring at all.
“Evidence suggests protocols that integrate calibrated CO monitoring and volumetric parameters can reduce ICU stay and organ dysfunction in select populations — but the treatment algorithm matters more than the monitor itself.” (Frontiers in Medicine)
Where gold-standard measurements remain preferable: refractory cardiogenic shock, VA-ECMO management, and any situation where the clinical decision (escalate to mechanical support, withdraw vasoactives) carries high stakes and requires the most accurate data available.
Key Takeaways
Cardiac output is the hemodynamic trigger for every major ICU decision, and CI below 2.2 L/min/m² is the threshold that demands action, not observation.
| Point | Details |
|---|---|
| CI normal range | CI of 2.5–4.0 L/min/m² is normal; CI below 2.2 L/min/m² is the common inotrope-consideration threshold. |
| Trend over single value | Prioritize the direction and rate of CO change over any one absolute reading. |
| Pair CO with perfusion markers | Always integrate CO with ScvO₂, lactate, and capillary refill; CO alone can be misleading in septic shock. |
| PLR requires real-time CO | A PLR-induced CO increase of ≥10% confirms fluid responsiveness only when measured with continuous monitoring. |
| Zerodeficitccrnprep for exam prep | The hemodynamic monitoring and cardiovascular study guides map these clinical concepts directly to CCRN exam objectives. |
A nurse-to-nurse perspective on CO monitoring
The most common mistake I see clinicians make with CO monitoring is treating the number as the answer. It is not. It is one variable in a picture that also includes what the ScvO₂ is doing, what the lactate trend looks like, whether the urine output has responded, and whether the patient’s skin is warm or mottled. A CI of 2.1 L/min/m² in a patient who just got a fluid bolus and whose lactate is falling is a very different clinical situation than the same CI in someone whose lactate is 6 and rising.
For the CCRN exam, CO and hemodynamic monitoring fall squarely in the cardiovascular competency domain, which is the largest single category on the exam blueprint. Mastering the CI thresholds, knowing when each monitoring method is appropriate, and understanding how to integrate CO with perfusion markers is not just good clinical practice. It is exactly what the exam tests. Apply the PLR checklist during your next shift. Run through the troubleshooting list when a CO reading looks off. The clinical habit and the exam skill are the same thing.
Zerodeficitccrnprep helps you master hemodynamics for the CCRN
Hemodynamics is where CCRN candidates lose the most points, and it is also where the clinical stakes are highest. Zerodeficitccrnprep’s cardiovascular study guides cover CO, shock classification, vasoactive titration, and mechanical support in the same nurse-to-nurse format as this article, built by ICU nurses who know exactly what the exam tests. The practice question bank includes scenario-based hemodynamics questions with detailed rationales that explain not just the right answer but why the wrong answers fail.
Start with the cardiovascular module, work through the hemodynamics practice questions, and use the AI-powered review tools to identify the gaps before exam day. Over 695 practice questions, system-based study guides, and spaced repetition are all in one place. Test your CO knowledge now with the CCRN practice questions.
Selected sources and further reading
These are the primary references behind this article, annotated for clinical and exam relevance.
| Source | Why it’s useful |
|---|---|
| Physiology, Cardiac Output — StatPearls, NCBI | Foundational physiology: CO equation, determinants, Fick principle, shock classification. High-yield for CCRN cardiovascular section. |
| Why Measure Cardiac Output? — PMC/NIH | Classic review of the clinical rationale for CO measurement; supports indications and interpretation sections. |
| Monitoring Cardiac Output — Intensive Care Medicine, Springer | Current review covering measurement methods, least significant change, and integration with perfusion markers. Primary source for interpretation and limitations content. |
| Hemodynamic Monitoring in the Critically Ill — Frontiers in Medicine | Covers PAC vs. transpulmonary thermodilution, PLR, and goal-directed therapy evidence. Supports measurement methods and therapy guidance. |
| Cardiac Output Measurement — Cambridge Core, Intensive Care Medicine | Comprehensive method-by-method overview; basis for the comparison table. |
| Understanding Cardiac Output — Cleveland Clinic | Accessible reference for normal ranges and CI thresholds; useful for patient-facing context and quick review. |
| Noninvasive CO Monitoring Trends — PMC | Supports the shift toward less invasive monitoring and the value of continuous trend data over intermittent measurements. |
| Non-invasive Methods of CO Measurement — Folia Cardiologica | Reviews bioreactance and bioimpedance accuracy limits; essential for understanding when noninvasive methods are and are not appropriate. |
FAQ
What is a normal cardiac index in the ICU?
A normal cardiac index is 2.5–4.0 L/min/m². A CI below 2.2 L/min/m² is the common clinical threshold for considering inotropic support in critically ill patients.
How does passive leg raising help assess cardiac output?
PLR is a reversible preload challenge: raising the legs to 45° transiently increases venous return. A CO increase of 10% or more, measured with continuous monitoring within 60–90 seconds, confirms fluid responsiveness.
Why can cardiac output be normal in septic shock but tissue perfusion still be inadequate?
In septic shock, microcirculatory dysfunction can dissociate CO from tissue oxygenation. CO may be preserved or elevated while lactate rises and ScvO₂ falls, which is why CO must always be interpreted alongside perfusion markers.
Which cardiac output monitoring method is most accurate?
Pulmonary artery catheter thermodilution is the clinical gold standard for intermittent CO measurement. Transpulmonary thermodilution (PiCCO-style) provides equivalent accuracy with the added benefit of continuous calibrated data and volumetric preload measures.
How does Zerodeficitccrnprep cover cardiac output for the CCRN exam?
Zerodeficitccrnprep’s cardiovascular study guides and CCRN topic guides cover CO physiology, CI thresholds, shock classification, and hemodynamic monitoring methods, all mapped to the AACN Adult CCRN exam blueprint.
Recommended
Take a Cardiovascular practice quiz
Test your mastery of hemodynamics, ACLS, MI, arrhythmias, and heart failure.
Get Your Free 20-Question CCRN Diagnostic
20 high-yield CCRN-style questions across every body system, with detailed rationales — emailed to you instantly.
No spam. One email + a couple of helpful follow-ups. Unsubscribe anytime.
Ready to pass your CCRN?
Join 12,000+ nurses using Zero Deficit — 695+ practice questions with rationales, AI-powered weak-area drilling, and spaced-repetition flashcards.
Start Free Trial →